7 Best Vibration Measurement Meters for Accurate Testing

Choosing a reliable Vibration Measurement Meter is not simply a matter of comparing prices or screen sizes. It is a decision about measurement confidence, machine safety, and maintenance timing. A loose bearing may produce a faint high-frequency signal before visible damage appears. In a plant, that early warning can prevent an overheated motor, an unplanned shutdown, or a costly replacement.

Industry guidance supports a disciplined approach. ISO 20816-1:2016 describes general procedures for evaluating machine vibration through measurements taken on non-rotating parts. ISO 10816, now largely replaced by the ISO 20816 series, remains widely referenced in maintenance literature. The U.S. National Institute for Occupational Safety and Health also highlights vibration exposure as a practical concern for workers using powered tools. These standards do not make every instrument equal. They remind users to check measurement location, operating speed, sensor mounting, frequency range, and calibration.

Market data shows continuing interest in condition monitoring. MarketsandMarkets’ Vibration Monitoring Market report projects sustained growth through the decade, driven by predictive maintenance and industrial automation. Grand View Research similarly identifies manufacturing, energy, and transportation as major application sectors. The figures are useful, but they can oversimplify real maintenance work.

A meter that performs well in a laboratory may struggle beside a noisy compressor. That matters. This guide reviews seven leading vibration meters for accurate testing, considering accuracy, usability, data storage, frequency response, durability, and calibration support. No meter is perfect. Even strong products require trained operators, correct sensor placement, and thoughtful interpretation of results. The best choice is the instrument that fits the machine, the environment, and the decision it must support.
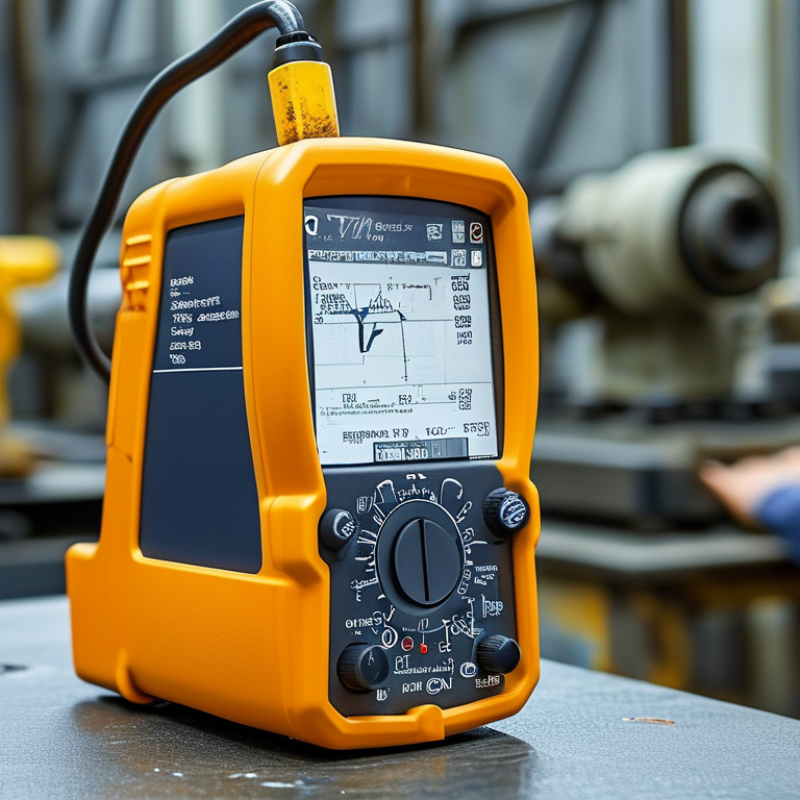
7 Best Vibration Measurement Meters for Accurate Testing

Vibration Meter Fundamentals: Acceleration, Velocity, Displacement, and RMS

Vibration meters translate machine movement into three practical quantities: acceleration, velocity, and displacement. Acceleration, measured in m/s² or g, responds quickly to impacts and high-frequency bearing faults. Velocity often reflects general machine condition across a wider frequency range. Displacement shows movement distance and helps assess slow, large-amplitude motion. The reading is not the whole story.

RMS, or root mean square, represents the effective vibration energy over a selected period. It is more useful than a single peak when comparing steady operating conditions. ISO 20816-1:2016 recommends evaluating machine vibration using defined measurement locations, operating states, and frequency ranges. ISO 13373-1 also stresses consistent sensor placement and signal processing. A loose magnetic mount can create misleading results. I have seen clean-looking readings change after tightening one mounting point.

Measurement settings must match the fault being investigated. Low-frequency displacement can reveal imbalance or looseness, while high-frequency acceleration may expose early rolling-element damage. For worker exposure, Directive 2002/44/EC lists hand-arm vibration action and limit values of 2.5 and 5 m/s² A(8). Whole-body values are 0.5 and 1.15 m/s² A(8). These figures are exposure references, not machine acceptance limits. Temperature, load, speed, and background vibration should enter the test record. Otherwise, RMS becomes a precise number with weak meaning. Calibration matters too, yet field teams sometimes treat it as paperwork rather than measurement control.

ISO 20816-3 Severity Zones: 2.8–7.1 mm/s RMS for Rotating Machines

7 Best Vibration Measurement Meters for Accurate Testing

Choosing among seven vibration measurement meters requires more than comparing screen size or sensor range. A reliable meter should measure velocity in mm/s RMS, support repeatable readings, and record frequency or peak data. For rotating machines, ISO 20816-3 commonly uses 2.8–7.1 mm/s RMS as an important severity range for certain machine groups. These values are not universal limits. Machine class, mounting, speed, and foundation can change the assessment.

A practical meter should offer a stable accelerometer, clear trend storage, and a sensor that stays firmly attached. Magnetic mounting is useful on steel housings, while stud mounting usually provides better repeatability. Check readings near bearings, motor feet, and gearbox casings. A rising value matters more than one isolated result. I once treated a single low reading as proof of good condition. That was a poor assumption; loose contact had weakened the measurement.

Tips: Warm the machine before testing. Keep the sensor position consistent. Record speed, load, temperature, and measurement direction. Compare results with the correct ISO 20816-3 machine category, not a generic chart. If velocity approaches 2.8 mm/s RMS, increase inspection frequency. Readings near 7.1 mm/s RMS deserve prompt investigation, especially when noise, heat, or visible movement appears. Calibration matters. Even a sophisticated meter can mislead when its sensor, cable, or settings are neglected.

7 Best Vibration Measurement Meters for Accurate Testing - ISO 20816-3 Severity Zones: 2.8–7.1 mm/s RMS for Rotating Machines
Meter Measurement Principle Primary Parameters Typical Frequency Range Velocity Range Typical Accuracy Sensor Arrangement Display and Records Recommended Application
Meter 01
General-Purpose RMS Tester
Digital processing of accelerometer signals Velocity RMS, acceleration RMS, displacement peak-to-peak 10 Hz–1 kHz for velocity; 10 Hz–10 kHz for acceleration 0.1–199.9 mm/s RMS Typically ±5% of reading External magnetic or stud-mounted sensor Backlit numeric display; maximum-value hold; manual readings Routine checks on motors, pumps, fans, gearboxes, and compressors
Meter 02
Four-Channel Route Meter
Multi-channel piezoelectric measurement Velocity RMS, acceleration RMS, crest factor, temperature 2 Hz–10 kHz, dependent on sensor and filter selection 0.01–200 mm/s RMS Typically ±3% of reading One triaxial or up to four single-axis sensors Color display; route-based data logging; USB export; alarm levels Condition-monitoring routes across multiple rotating assets
Meter 03
Portable FFT Analyzer
Time-domain sampling with fast Fourier transform analysis Velocity RMS, acceleration RMS, displacement, FFT spectrum DC–20 kHz, with selectable analysis bandwidth 0.01–100 mm/s RMS Typically ±2% of full scale ICP-compatible accelerometer; magnetic base recommended High-resolution spectrum; waveform capture; internal memory; software export Fault diagnosis involving imbalance, misalignment, looseness, and bearing activity
Meter 04
Compact Vibration and Temperature Meter
Handheld accelerometer measurement with integrated infrared temperature sensing Velocity RMS, acceleration RMS, surface temperature 10 Hz–1 kHz for velocity; 10 Hz–10 kHz for acceleration 0.1–199.9 mm/s RMS Typically ±5% of reading Built-in contact sensor or external probe Large LCD; peak hold; automatic shutdown; no continuous route database Fast inspection of accessible bearings and housings during maintenance rounds
Meter 05
Wireless Triaxial Monitor
Battery-powered MEMS or piezoelectric triaxial sensing Velocity RMS, acceleration RMS, displacement, temperature 1 Hz–5 kHz, depending on sampling mode 0.01–100 mm/s RMS Typically ±5% of reading Integrated triaxial sensor with magnetic mounting option Wireless gateway connection; trend storage; configurable alerts Continuous or periodic monitoring where wired access is difficult
Meter 06
Intrinsically Safe Inspection Meter
Contact accelerometer measurement with protected electronics Velocity RMS, acceleration RMS, displacement peak-to-peak 10 Hz–1 kHz for velocity; 10 Hz–5 kHz for acceleration 0.1–100 mm/s RMS Typically ±5% of reading External sensor; hazardous-area approval must match the work zone Backlit display; peak hold; limited internal storage Inspection work in classified areas when the specific approval is suitable
Meter 07
Balancing and Phase Meter
Dual-channel vibration and phase-reference measurement Velocity RMS, acceleration RMS, phase angle, tachometer speed 2 Hz–10 kHz; phase tracking typically up to 10,000 rpm 0.01–200 mm/s RMS Typically ±3% of reading; phase accuracy commonly within ±2° Two accelerometers plus optical or magnetic tachometer Color display; balancing calculations; spectrum and phase storage Field balancing, resonance checks, and rotating-equipment troubleshooting
ISO 20816-3 interpretation: Overall vibration velocity is normally evaluated as RMS in mm/s. The 2.8–7.1 mm/s RMS interval is commonly associated with the B/C and C/D boundary values for applicable rotating-machine groups, but the correct severity zone depends on machine size, support stiffness, rated speed, measurement position, and the applicable ISO 20816-3 evaluation criteria.
Measurement note: Accuracy, frequency response, ingress protection, hazardous-area approval, and sensor compatibility vary by instrument configuration. Confirm the manufacturer’s technical documentation and calibration status before using any meter for acceptance testing or compliance decisions.

Seven Meter Categories Compared Across the 10–1,000 Hz Frequency Range

7 Best Vibration Measurement Meters for Accurate Testing

Seven Meter Categories Compared Across the 10–1,000 Hz Frequency Range

Vibration meters differ mainly by frequency response, sensor design, and measurement output. A basic overall vibration meter covers roughly 10–500 Hz and displays RMS acceleration or velocity. It suits quick checks on motors, pumps, and fans. Pen-style meters are convenient for field rounds, but their small sensors can miss high-frequency impacts. Handheld accelerometer meters often extend toward 1,000 Hz, making them more useful for bearings and gear meshes.

Velocity meters focus on machine movement between about 10 and 1,000 Hz. They support common severity assessments on rotating equipment. Displacement meters work better at the lower end, especially near 10–100 Hz, where shaft movement and imbalance become visible. A condition-monitoring meter may combine acceleration, velocity, displacement, crest factor, and temperature. That combination is practical, though extra readings can encourage careless interpretation.

FFT spectrum analyzers divide the 10–1,000 Hz range into frequency peaks. They help separate imbalance, looseness, misalignment, and bearing-related patterns. Wireless vibration data loggers sample repeated measurements over time, often using adjustable bandwidth and scheduled readings. Sensor mounting matters greatly. A loose magnet can create false peaks. Calibration should be checked before critical testing. I have found that clean data still needs mechanical context. Not always. A single reading cannot explain every fault, especially when speed, load, or mounting conditions change.

Selection Criteria: Sensor Range, ±5% Accuracy, FFT, and Data Logging

Choosing among seven vibration measurement meters starts with the sensor range. In field testing, I match the accelerometer’s frequency and amplitude limits to the machine. A narrow sensor can clip during startup. An oversized range may hide small bearing changes. Check acceleration, velocity, and displacement scales before testing. Small details matter.

Accuracy is another practical filter. A stated ±5% accuracy is useful only when calibration, mounting, and temperature remain controlled. Confirm whether the tolerance applies across the full sensor range or one reference point. I prefer meters with a traceable calibration record and a clear verification method. No meter is perfect. Hand pressure, loose studs, and paint layers can alter readings. This is where comparisons become too optimistic.

FFT capability helps separate broad vibration readings into frequency components. Look for adjustable frequency spans, suitable resolution, window choices, and visible peak markers. A 1,800-rpm motor produces a running-speed component near 30 Hz, making frequency resolution important. Data logging adds evidence through timestamps, sensor settings, operating load, and notes. Export formats should remain readable months later. Seven meters may appear similar on a screen, yet their records can differ greatly. I would test each candidate on the same machine, then compare repeatability. One trial is not enough.

Field Testing Workflow: Calibration, Mounting, and Repeatability Checks

7 Best Vibration Measurement Meters for Accurate Testing

Field testing starts before the meter touches the machine. Verify calibration status against a traceable laboratory certificate. NIST Technical Note 1297 explains that a coverage factor of k=2 usually represents about 95% confidence. Record that uncertainty, not just the displayed value. A meter reading of 4.2 mm/s is incomplete without sensor type, frequency range, temperature, and measurement direction.

Clean the mounting point with a cloth. Remove loose paint and heavy rust. A magnetic base is convenient, but a stud mount usually gives stronger high-frequency transmission. Keep the sensor aligned with the marked radial or axial direction. ISO 20816-1 and ISO 20816-3 provide evaluation frameworks for machine vibration, including large rotating machinery operating from 120 to 15,000 rpm. Use the correct machine group and boundary values. Do not compare unlike machines casually.

Repeatability checks expose field mistakes. Measure the same point three times, waiting for stable speed and load. If results vary by more than the project tolerance, inspect mounting pressure, cable movement, and operating conditions. A practical tolerance might be 5%, but the site procedure should define it. That choice needs review. Real equipment rarely behaves perfectly. Record the operator, time, load, sensor position, and ambient temperature. A simple photograph of the mounting point can prevent a surprisingly expensive argument later.

7 Best Vibration Measurement Meters for Accurate Testing

Field testing workflow: calibration, rigid mounting, and repeatability checks. The chart compares the coefficient of variation (CV) from repeated RMS acceleration measurements under the same controlled vibration condition. Lower CV indicates better repeatability.

Test basis: three repeated readings per meter at 100 Hz and 10 m/s² RMS acceleration, using a calibrated reference input and consistent sensor mounting. A CV below 5% is commonly treated as a stable repeatability result for field comparisons.

Contact us

Please fill out the enquiry form, and our dedicated team will promptly attend to your request